Introduction to Dashboard
Introduction
Bika Dashboard is an intelligent platform for data visualization and analysis. It offers comprehensive data analysis solutions through modular components, enabling multi-dimensional data insights, real-time business monitoring, dynamic interaction analysis, and professional - grade dashboards.
Operating Instructions
Creating a New Dashboard
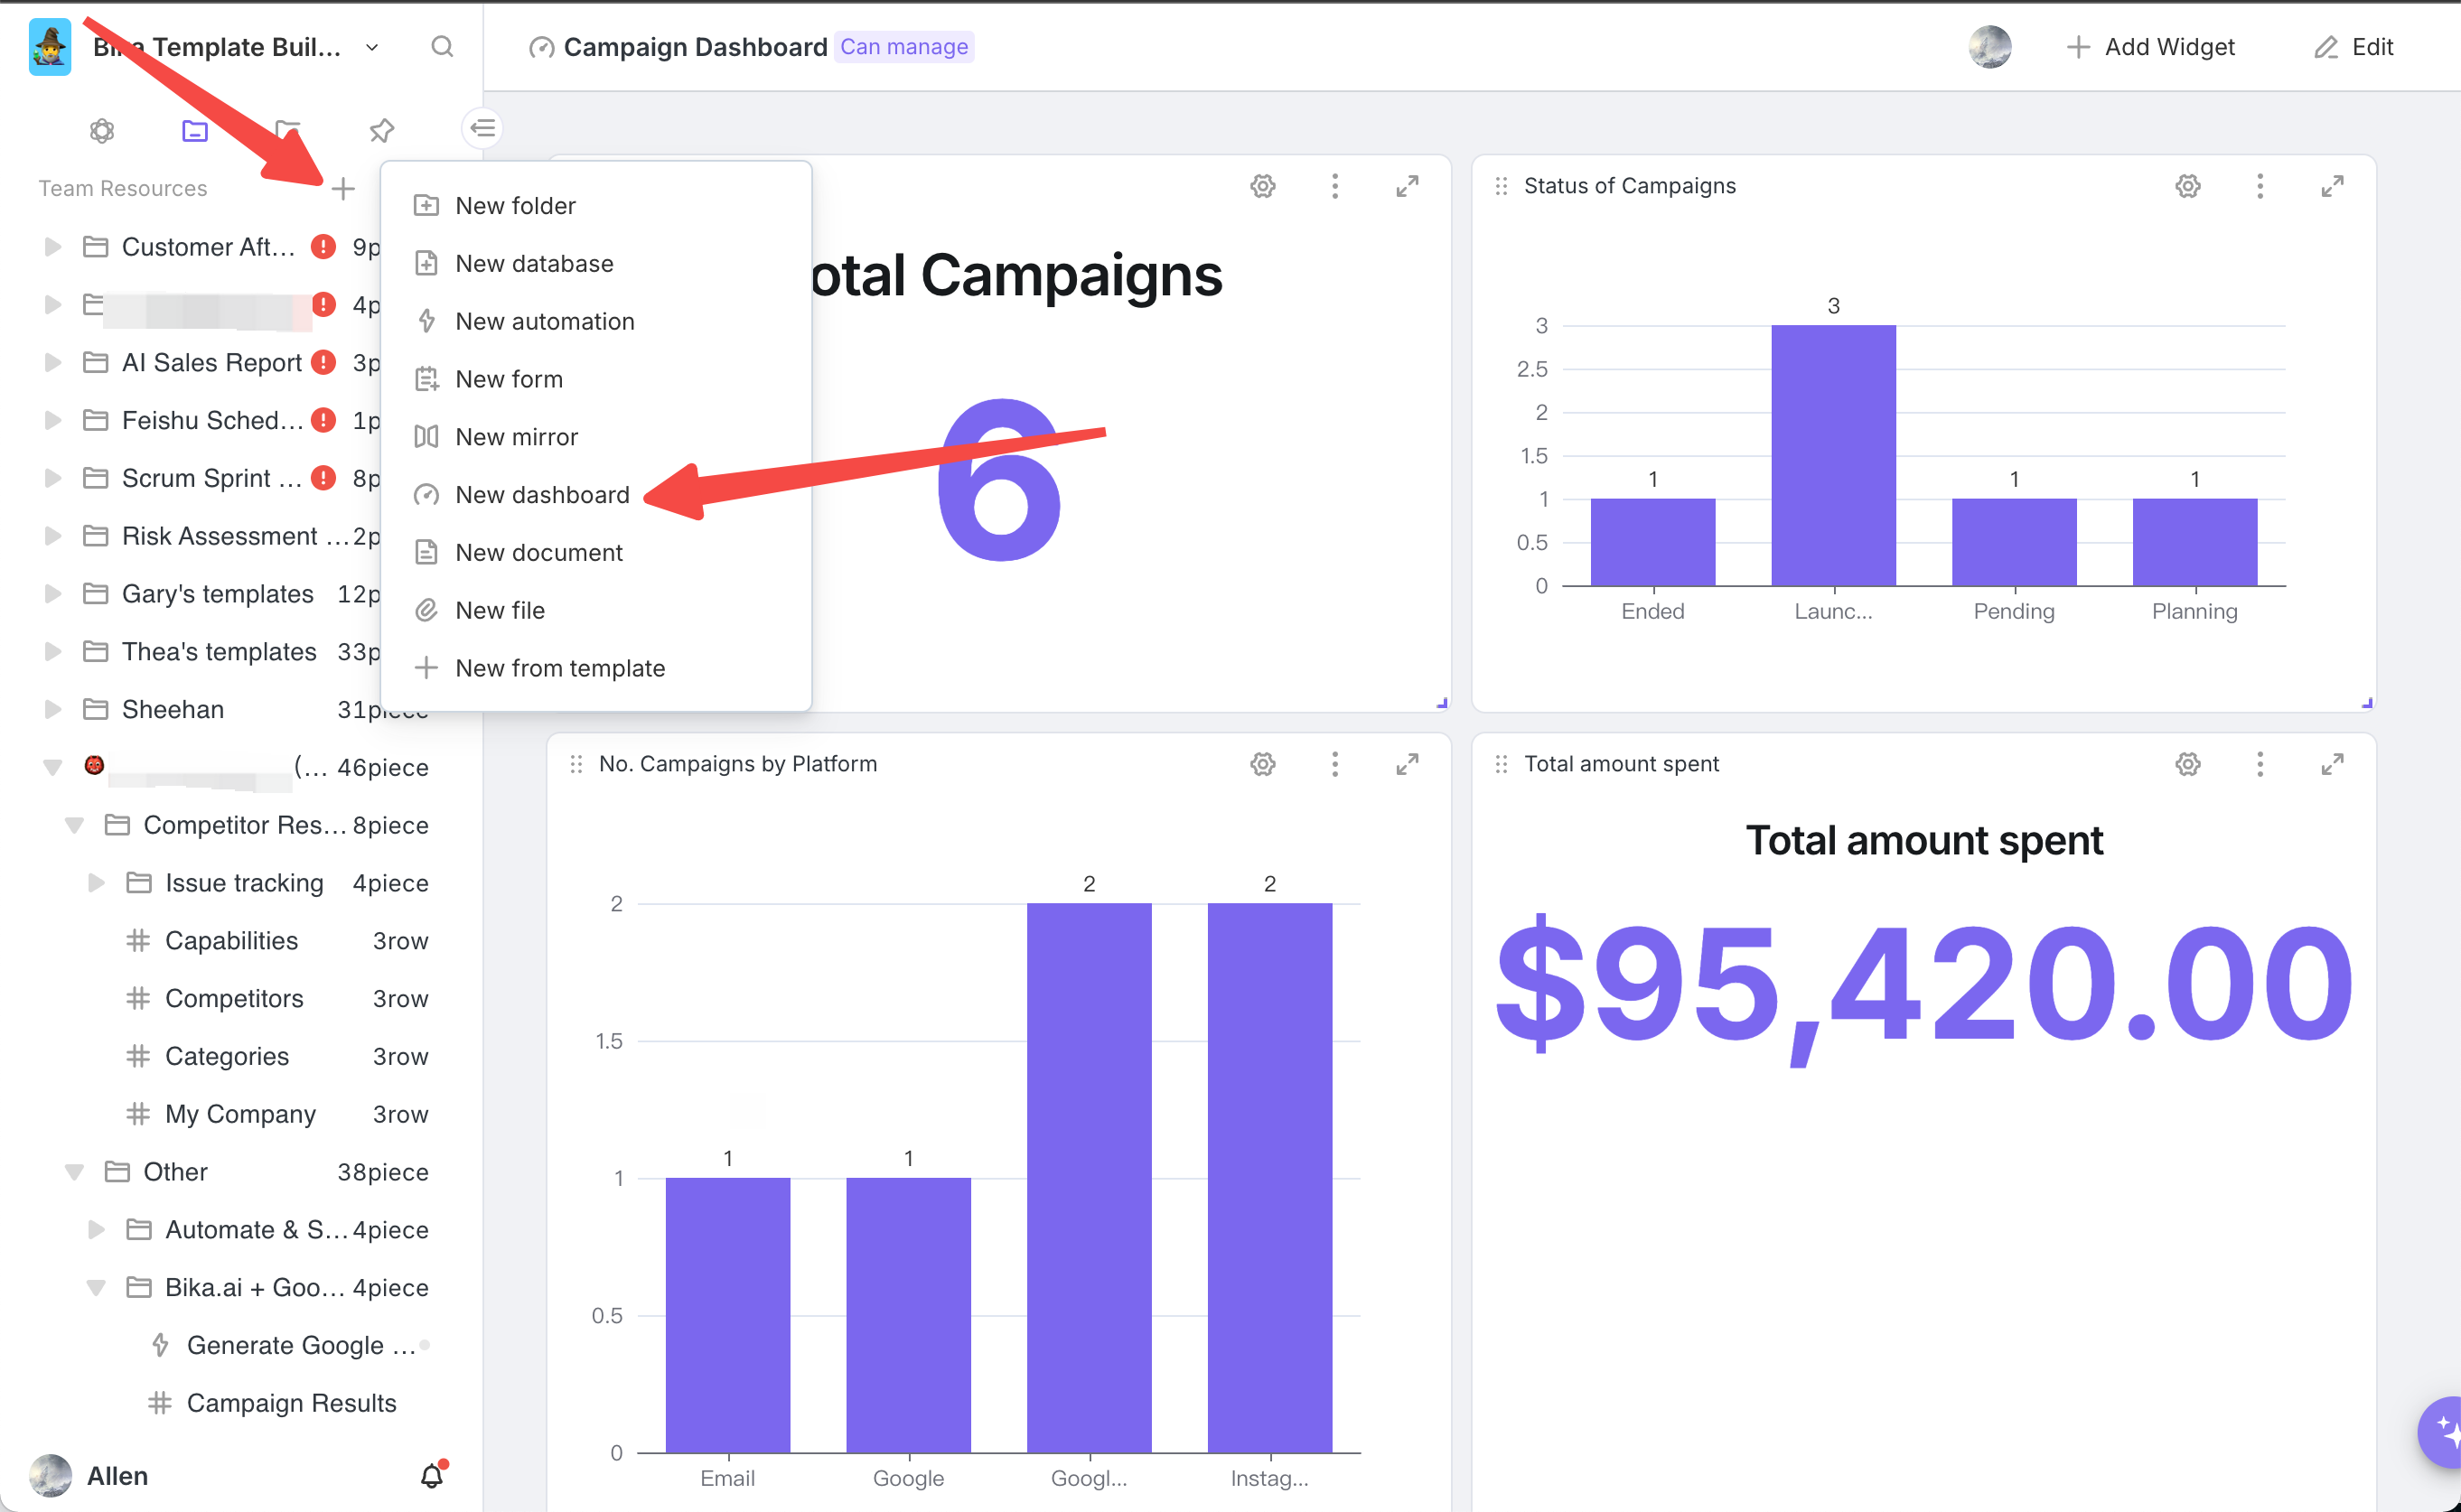
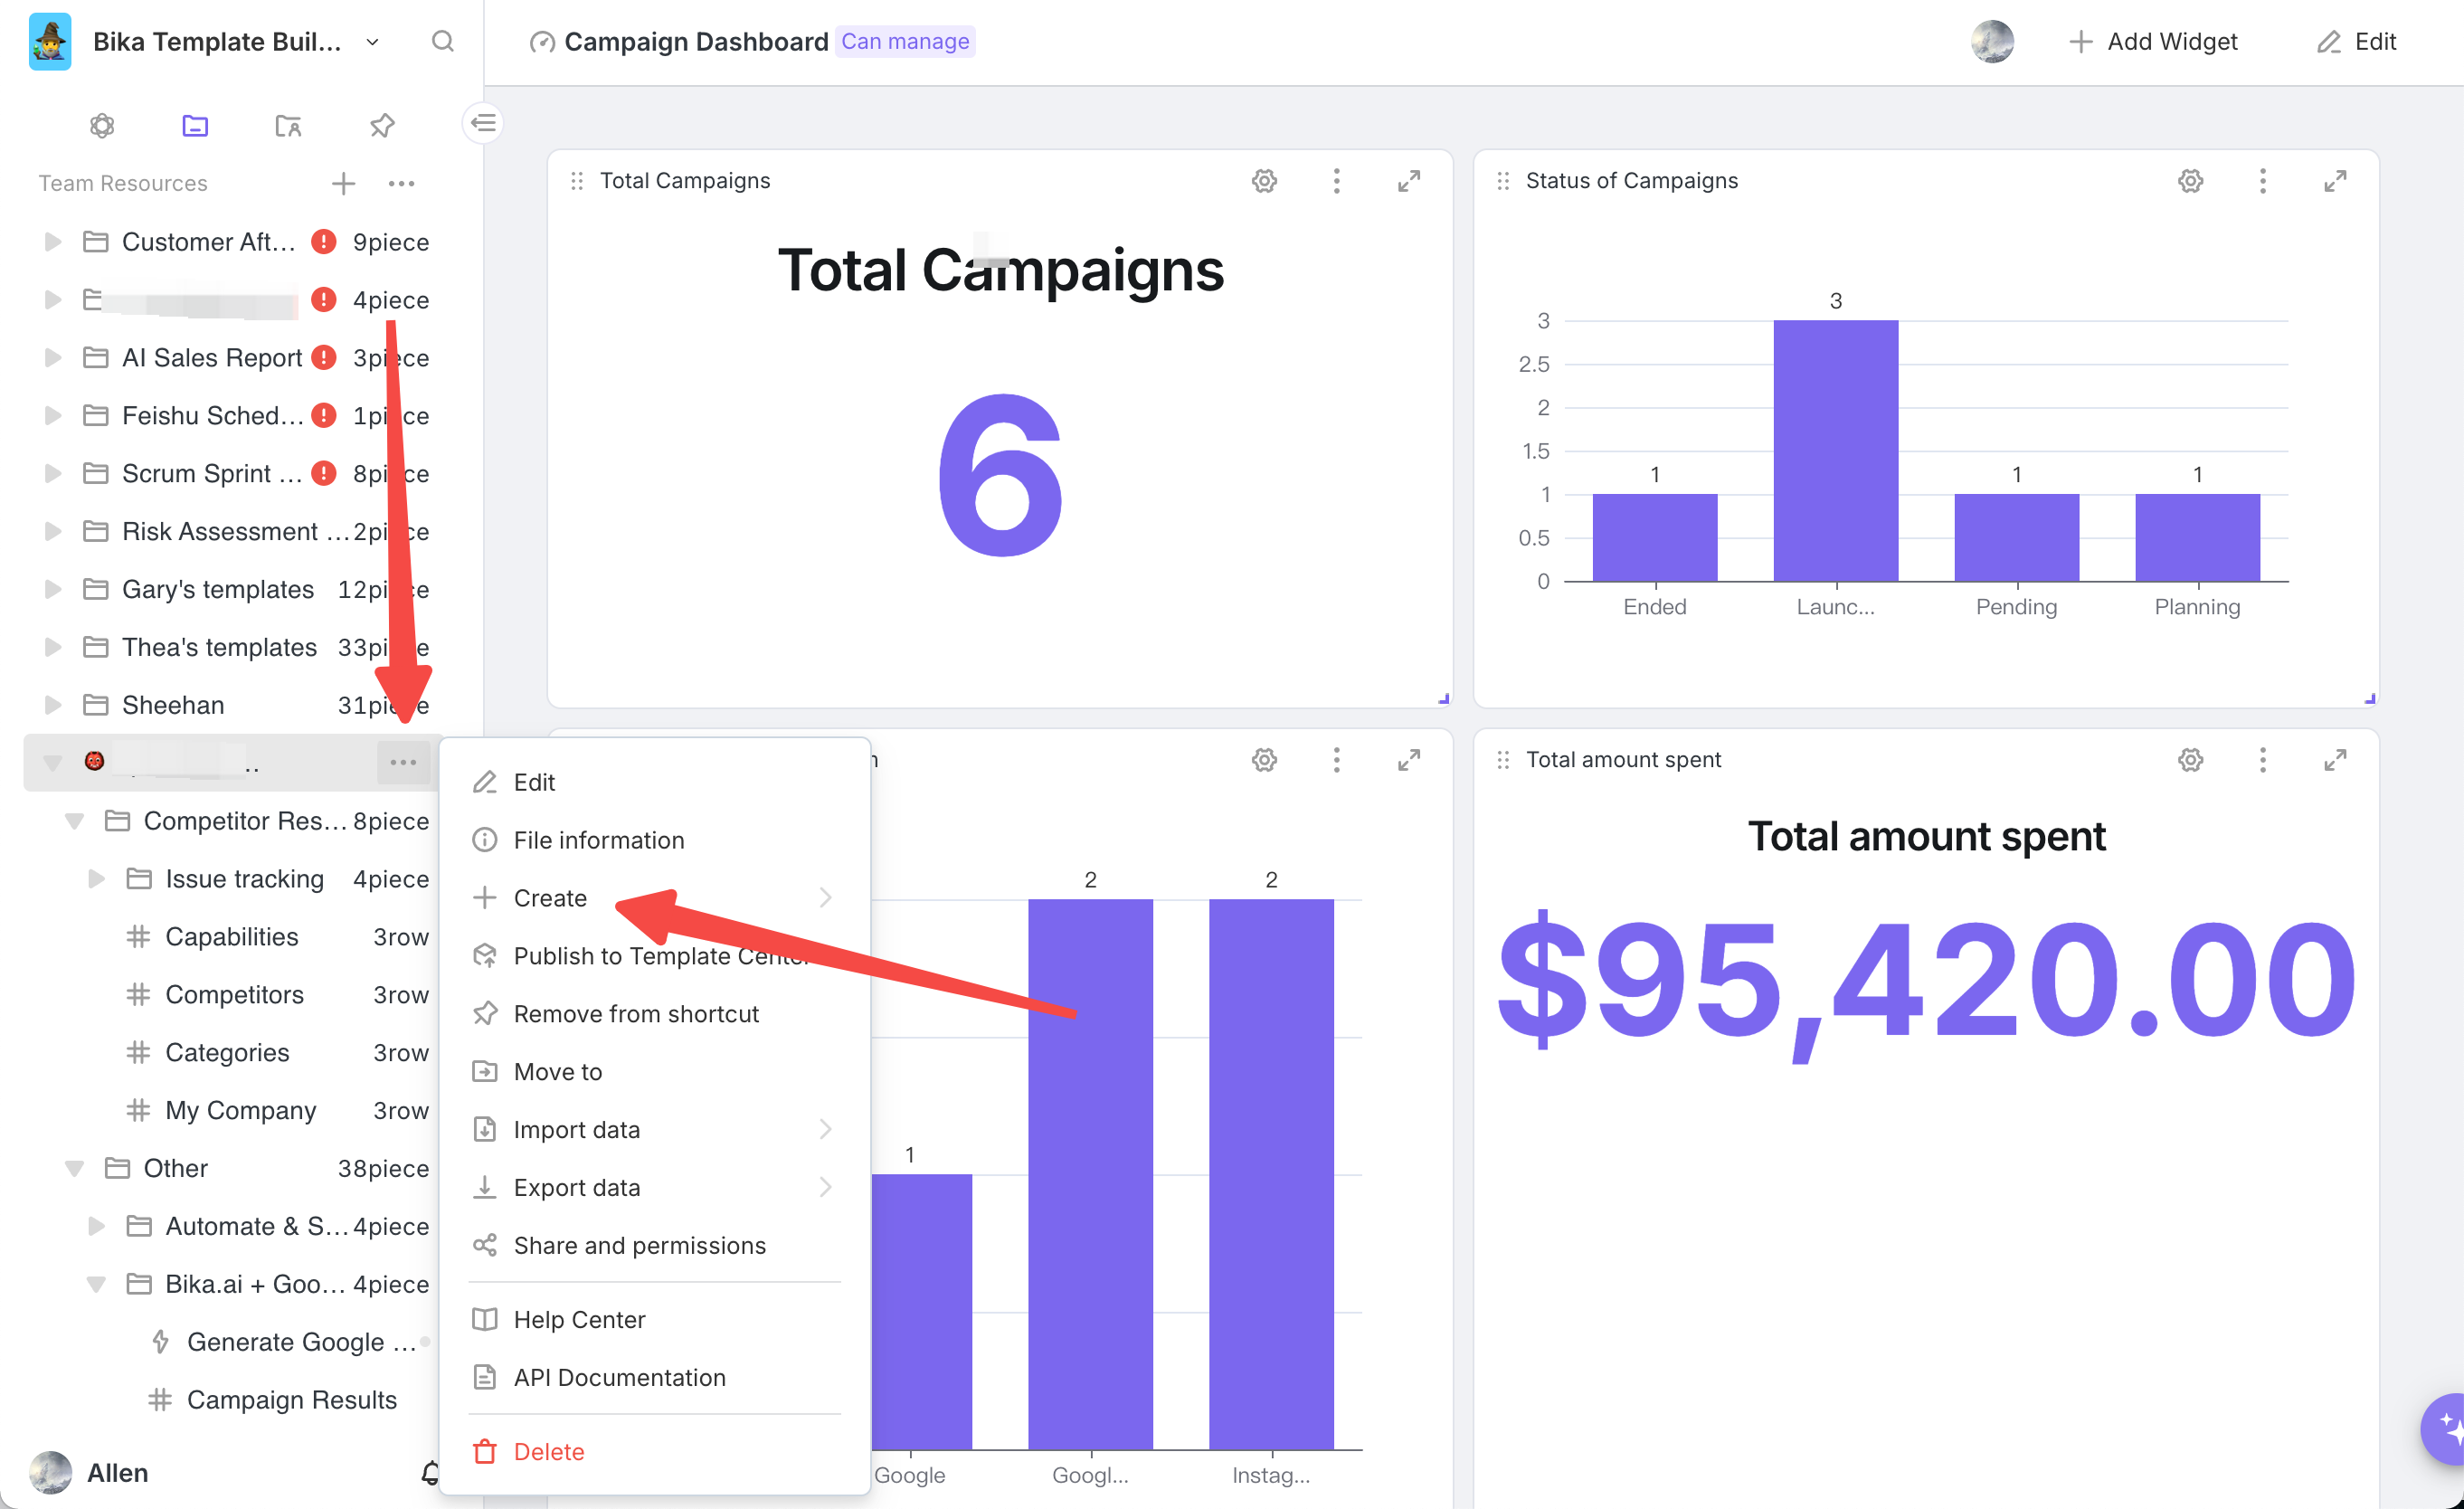
Click "+ " above the workspace directory and select "New Dashboard". You can also click "..." next to any folder to create a new dashboard.


Adjusting Components
-
Resizing Components:After adding a component, position your mouse at its lower - right corner and drag to resize.
![]()
-
Repositioning Components:Place your mouse at the component's upper - left corner, hold and drag the mouse to reposition.
![]()
-
Reconfiguring Components:Click the "Settings" icon at the component's upper - right corner, then choose "widget setting" in the menu to reconfigure.
![]()
![]()
-
Expanding for Viewing:Click the "Expand to View" button at the dashboard's upper - right corner to switch to full - screen pop - up mode, ideal for presentations.
![]()
![]()

Recommend Reading
- Automating Investor Deal Flow: Unveiling the Best Email Client for Mac
- Beyond ChatGPT: Choosing the Right AI Tool for YouTube Publishing Process Automation - Bika.ai Compared
- Automating Project Management with the Best Email Client for Mac: Unleashing the Power of Bika.ai's Project Tracker
- Achieve Peak Email Efficiency for Sales Teams: The Best Email Client for Mac & The Power of `Sales Strategy`
- Beyond Tracking: How the Product Feedback Form Template Boosts Your Habit Tracker Workflow
Recommend AI Automation Templates


