产品指南
大数据多维表格
仪表盘
空间站
集成指南
自动化指南
企业AI智能体模板
私有化部署
开发者与扩展
最佳实践
marketing
功能参考
自动化触发器
自动化执行器
第三方集成
节点资源
数据表视图
数据表字段
仪表盘组件
智能任务
AI 向导
公式
空间站
更新日志
视频演示
透视表小组件
透视表小组件是数据分析工具中的核心功能之一,支持通过多维度分组和灵活汇总,快速生成结构化统计报表。无论是销售数据统计、库存分析,还是运营指标监控,均可通过简单配置实现数据聚合计算(如求和、平均值、最大值、最小值等),并以直观的交叉表格形式展示。
核心功能
- 多维度分组:支持按行维度(Row)和列维度(Column)对数据进行分组。
- 多样化统计:提供求和(Sum)、平均值(Average)、最大值(Max)、最小值(Min)等多种汇总方式。
使用步骤
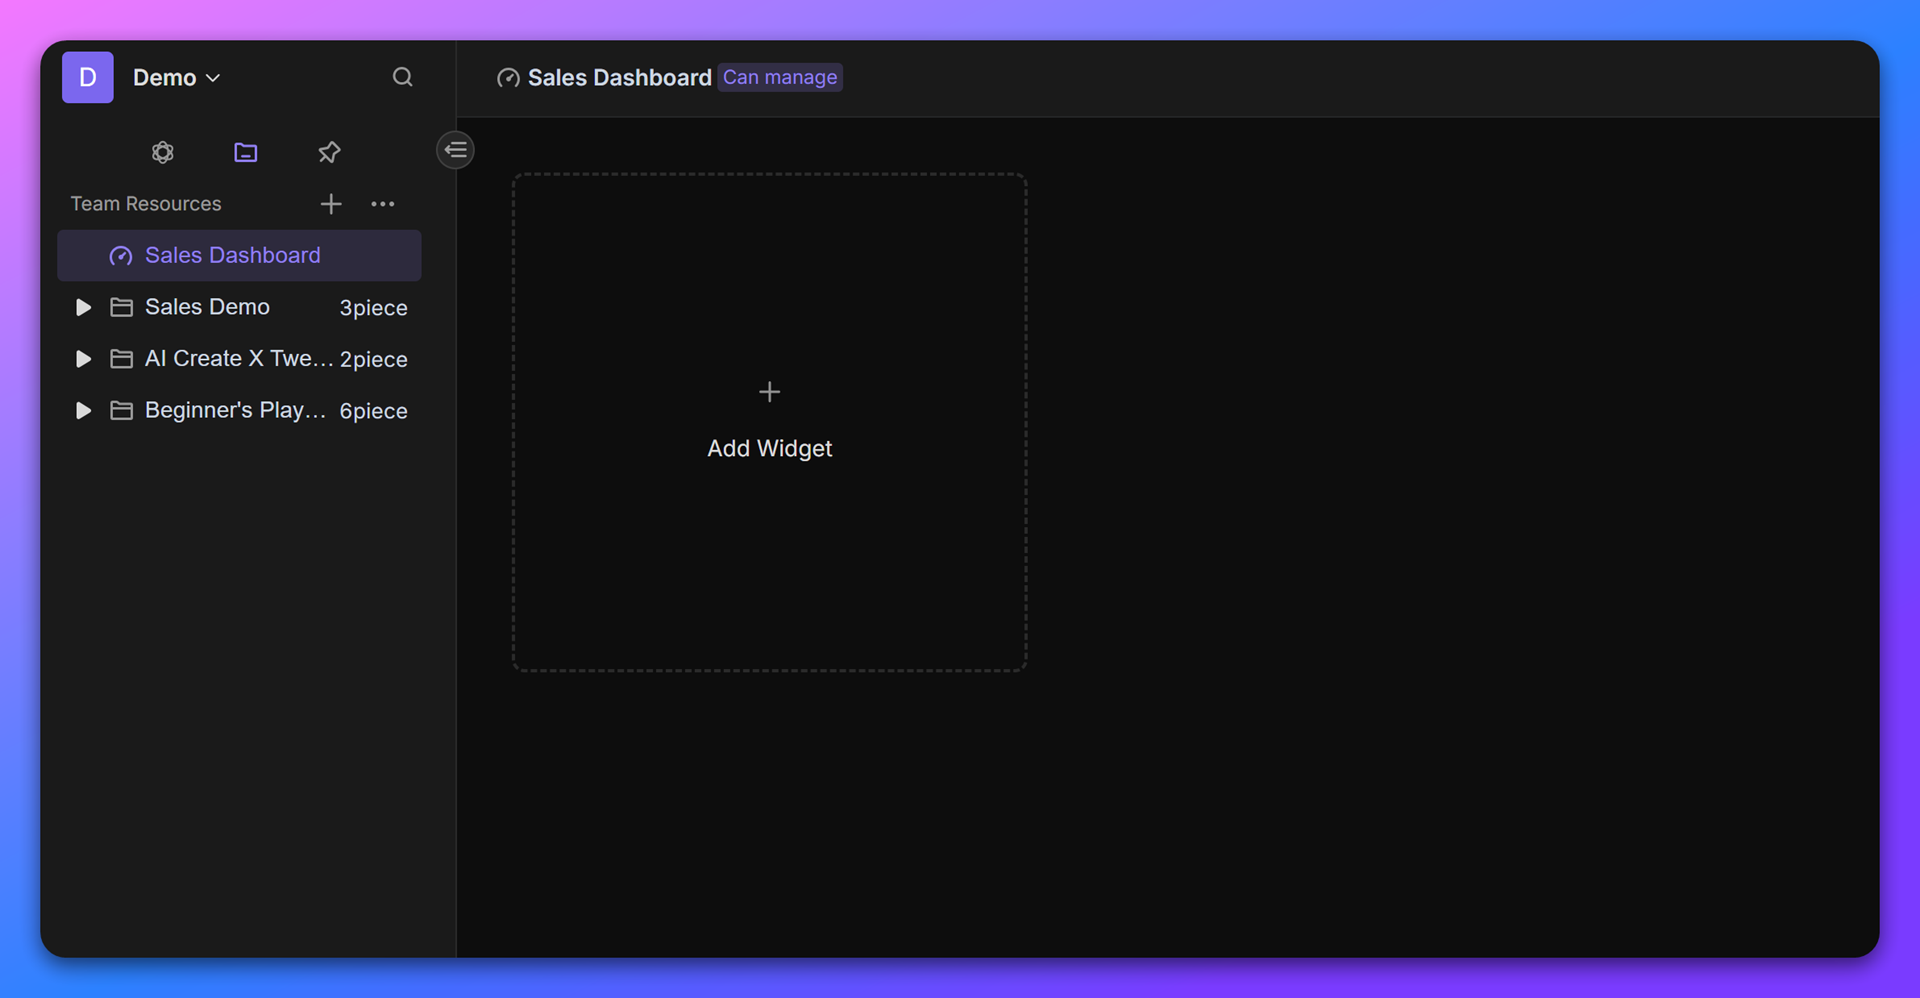
- 创建仪表盘
进入空间站,新建一个仪表盘(Dashboard)。点击工具栏的 “+ 添加小组件”,选择 “透视表”。
- 配置数据源
- 在小组件配置界面中指定需要分析的数据库(Database)和数据视图(View)。
- 设置行与列维度
- 行维度(Row Dimension):通常放置一级分类字段(例如“销售平台”),数据将按此字段纵向分组。
- 列维度(Column Dimension):通常放置二级分类字段(例如“SKU”),数据将按此字段横向分组。
示例: 若需按“销售平台”查看各“SKU”的销售情况,则:
- 行维度:
销售平台- 列维度:
SKU
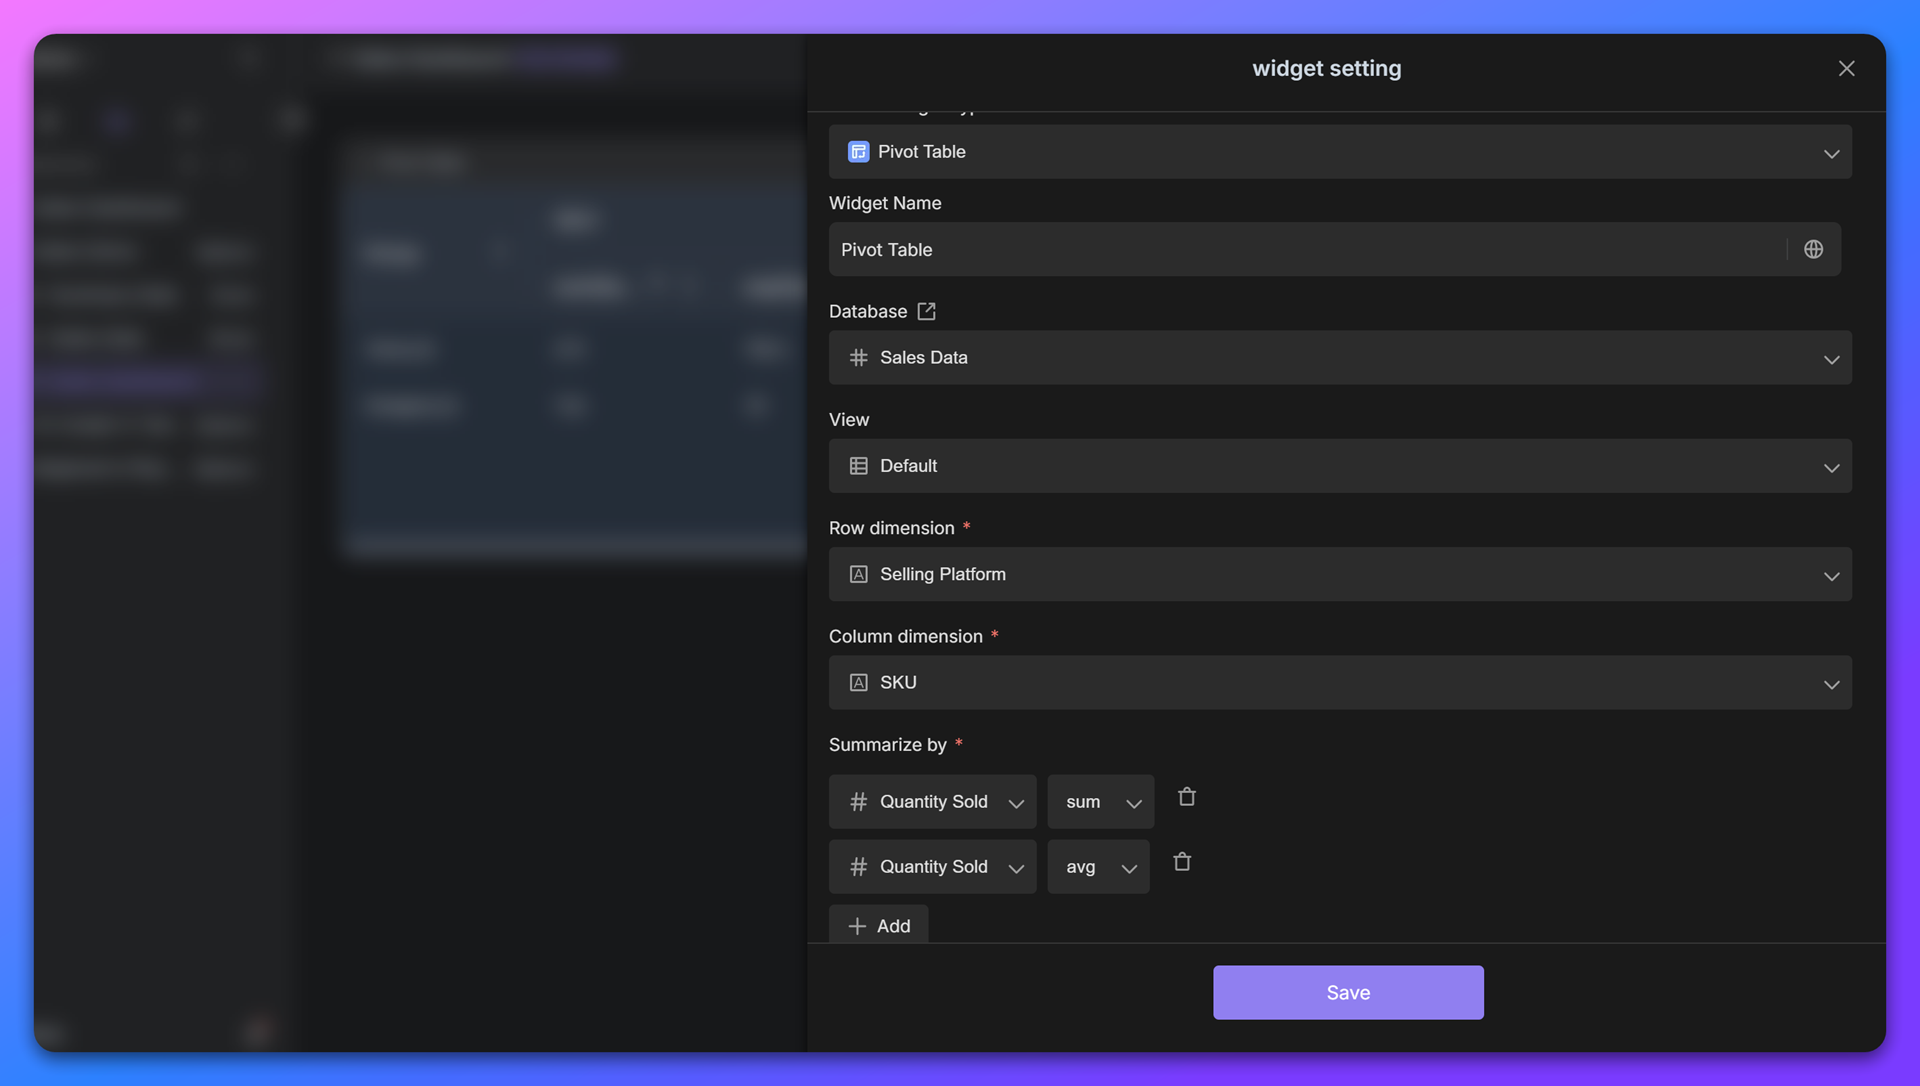
- 添加汇总指标
在 “Summary by”(汇总方式)中,配置需要计算的数值字段及统计方式:
- 点击 “+ 添加”,选择目标数值字段(例如“销售量”)。
- 设置统计方式:
- Sum:求和
- Average:平均值
- Max:最大值
- Min:最小值
示例: 若需统计各平台下各SKU的总销量,则添加指标:
Quantity Sold→ Sum
- 生成与保存
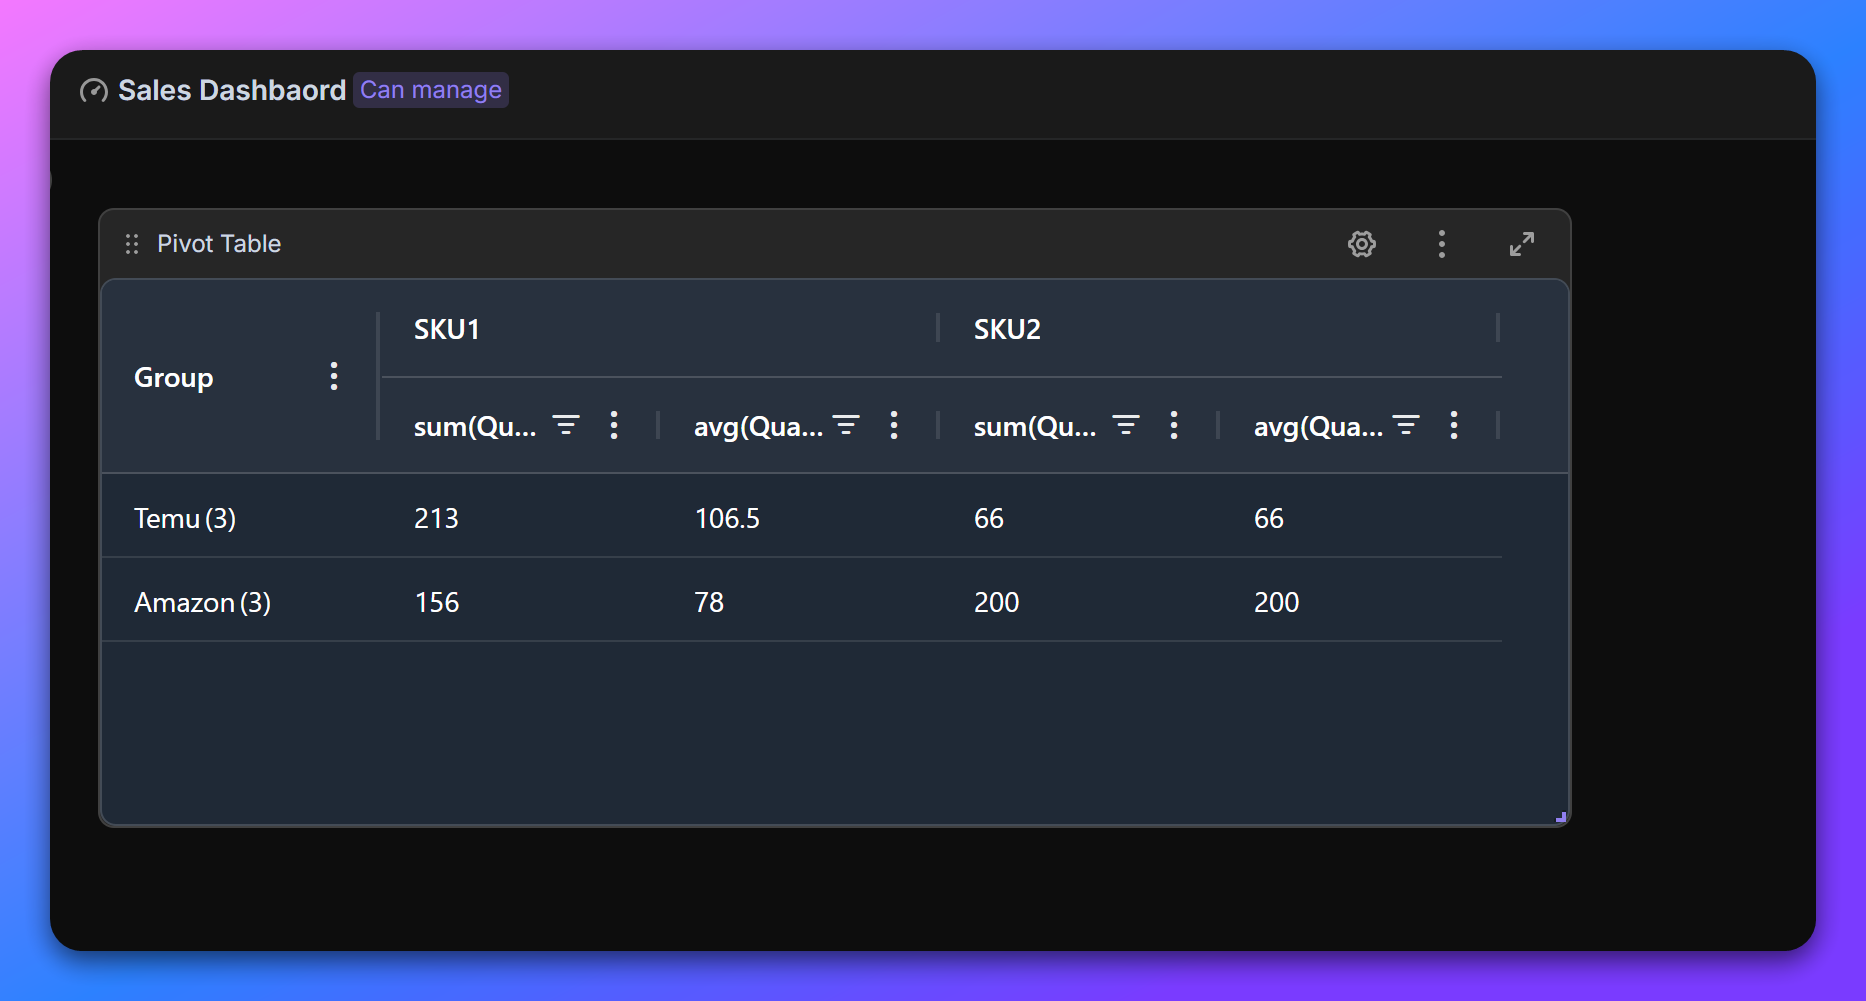
完成配置后,点击 “保存”,系统将自动生成透视表。报表会以交叉形式展示数据,例如:
- 每行代表一个销售平台,每列代表一个SKU,单元格内显示对应的汇总值(如总销量)。
应用场景示例
销售数据统计
假设原始数据包含:
- 行维度:销售平台(Temu、Amazon、Tiktok)
- 列维度:SKU(商品A、商品B、商品C)
- 汇总指标:销售量(求和)
配置完成后,透视表将呈现以下结构:
销售平台 \ SKU | 商品A | 商品B | 商品C |
Temu | 150 | 200 | 120 |
Amazon | 90 | 180 | 75 |
Tiktok | 210 | 150 | 95 |
进阶技巧
- 多指标叠加:在“Summary by”中重复添加同一字段并选择不同统计方式(如同时计算“总销量”和“平均销量”)。
- 维度调整:若需更精细分析,可添加多层级行/列维度(例如“销售平台”+“地区”)。
- 排序与筛选:点击表头可对数据进行排序,或通过右侧筛选器聚焦关键信息。

推荐阅读
推荐AI自动化模板
CSV-to-Database Automation Examples
The CSV-to-Database Automation Examples template offers practical tools to enhance your data management process. It includes the "Imported Data" database, which streamlines product tracking with essential fields like product ID and sales trends. Paired with the "CSV to Database" automation tool, you can easily trigger CSV file imports and convert data into a usable format, improving your workflow efficiency.
Z
zapier

Travel Guide
This template is a comprehensive travel itinerary management tool, containing multiple feature-rich tables and dashboards for recording and managing travel companions, trip preparations, hotel arrangements, attraction information, and itinerary planning. With various views and data association capabilities, users can efficiently complete pre-trip preparations and itinerary management, enhancing the overall travel experience.

特朗普推特舆情 - 股市影响分析
通过 Bika.ai 与 ToolSDK.ai 集成,自动化抓取特朗普最近 7 天内的 10 条相关推文(免费版限制),利用 AI 生成结构化报告,分析其对美股及关联概念股的短期波动与长期趋势影响,含风险预警与投资建议,支持每日定时执行与历史数据存档

User Story Mapping
This folder contains the Bika.ai User Story Mapping Template, designed to help teams effectively organize and prioritize user stories. With this template, you can clearly visualize the user journey, identify key features, and ensure that new capabilities align with user needs.

Value-Risk Matrix
Manage tasks by prioritizing them based on risk and value, and trigger automated notifications for high-priority tasks